The Analytics tab in AI Coach gives you a consolidated view of your entire team’s performance across all scorecards. You can jump from a high-level team overview to any individual rep’s stats in a single click, drill into specific scorecard results, and use the performance table to quickly spot who needs coaching and where.Documentation Index
Fetch the complete documentation index at: https://docs.triplesession.com/llms.txt
Use this file to discover all available pages before exploring further.
Accessing Analytics
Open the Analytics tab
Inside AI Coach, click the Analytics tab. You land on the team performance dashboard.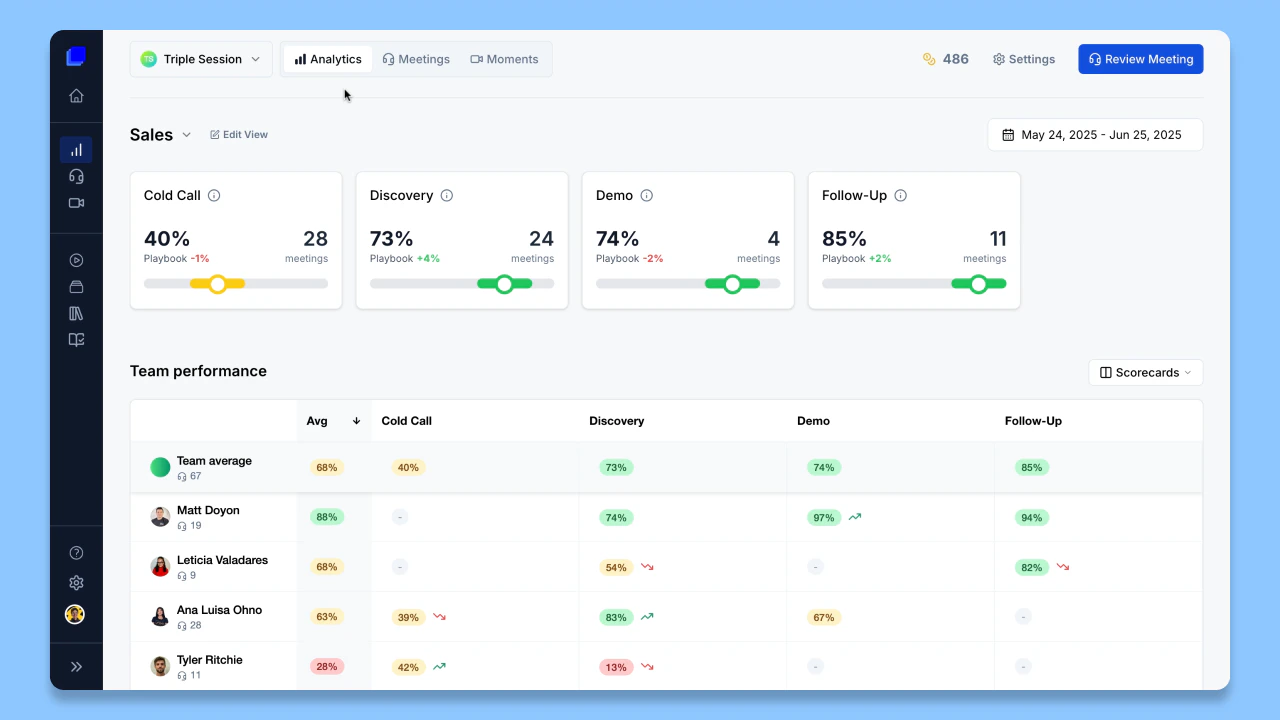
The dashboard only shows scorecards that have call data by default, keeping the view clean. You can still add scorecards with no data — they appear with “0” values until calls are logged against them.
Navigating from team overview to individual performance
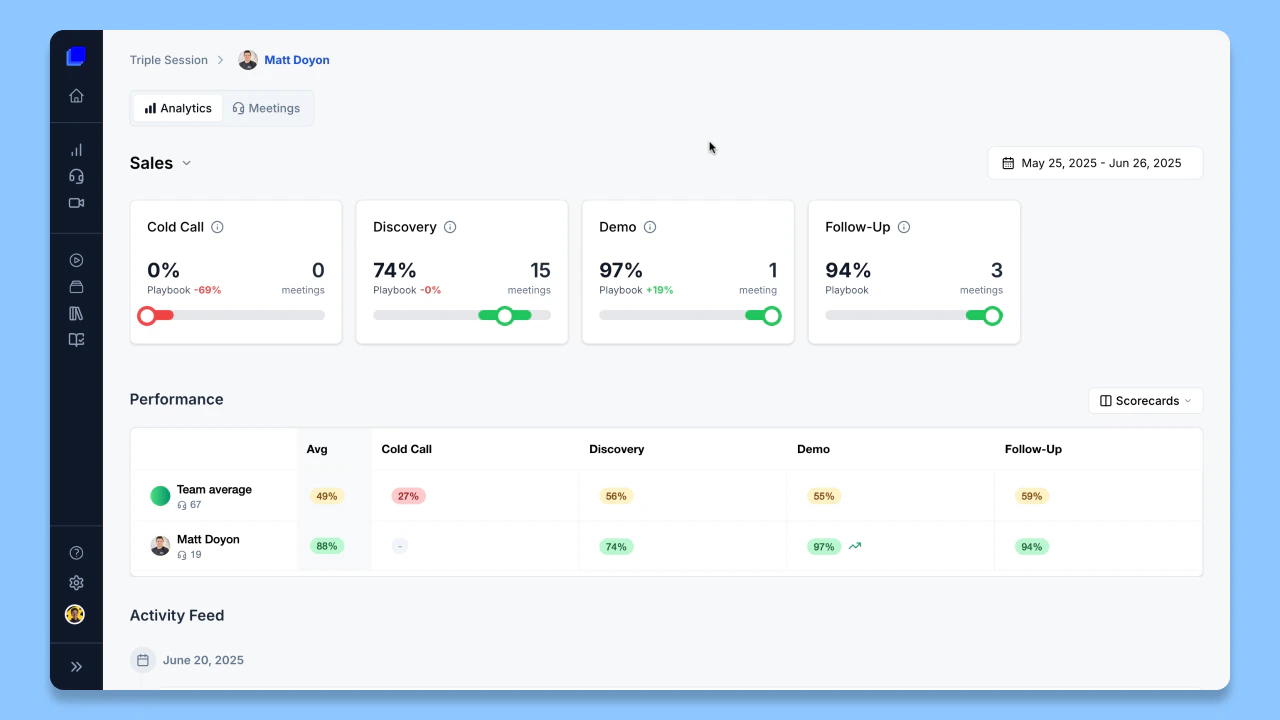
The dashboard opens on the team view, where you can see aggregate scores for each scorecard across all reps. To drill into a specific rep:- Find the rep’s name in the Performance table.
- Click their name to open their individual dashboard.
Drilling into specific scorecards
You can view a detailed breakdown for any scorecard in two ways:- From the top of the dashboard — Click directly on the scorecard card you want to explore.

- From the Performance table — Click on any score value (for example, “74%” under “Discovery”) on either the team view or an individual rep’s view to go directly to that scorecard’s dashboard.
Customizing scorecard views
You can create multiple named views to organize how scorecards are displayed:- Click the dropdown on the current view to create a new view.
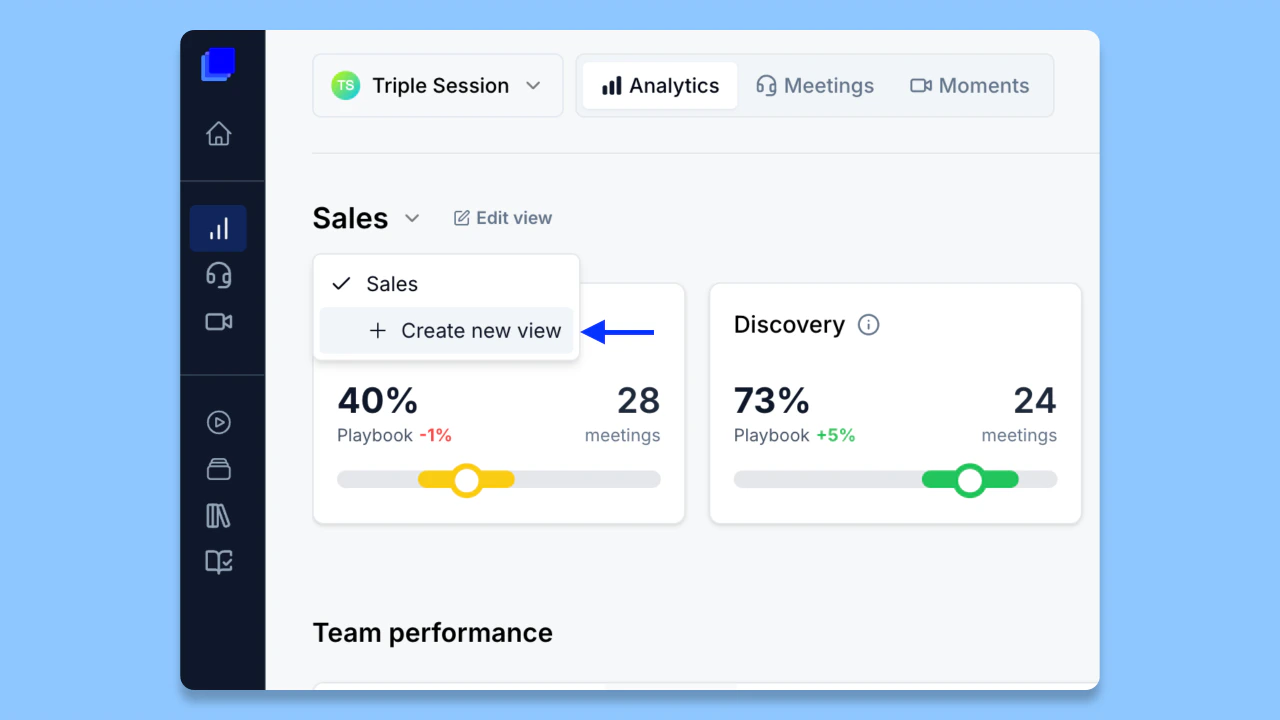
- Rename any view by editing its title.
- Drag and drop scorecards within a view to change their display order.
View customizations are workspace-specific. Changes you make in one workspace do not affect other workspaces.
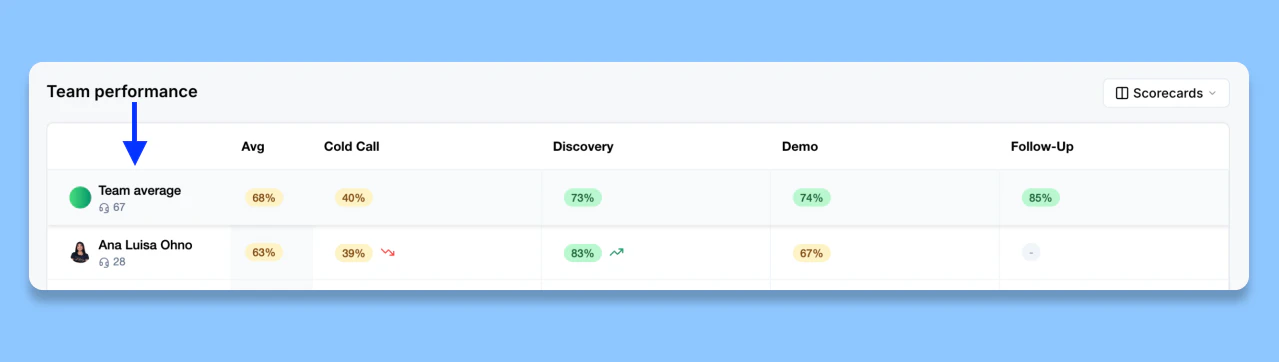
Using the Performance table for quick insights
The Performance table is the fastest way to spot patterns across your team:- The Team Average column shows the benchmark for every scorecard, so you can compare individual rep results against the team norm.
- Sort any column to surface top performers or identify scorecards where the team is struggling collectively.

All data shown in Analytics respects the active date filter, which defaults to the last 30 days. Playbook adherence metrics are always compared to the previous period.
Best practices
- Run daily or weekly pulse checks — Use the team overview as your go-to for quick check-ins on overall team health and progress.
- Tailor views per workspace — Customize each workspace to surface the scorecards most relevant to that team. For example, a Sales workspace might prioritize sales scorecards, while a Customer Success workspace focuses on CS scorecards.
- Coach proactively — Regularly review individual rep timelines and pay attention to highlighted Risks and Action Items to provide timely, targeted coaching.
- Use sorting to find trends — Sort columns in the Performance table to quickly recognize top performers or identify collective weak spots.
- Monitor adherence over time — Watch the previous-period comparison for playbook adherence to understand whether coaching and process changes are having an impact.
FAQ
Why are some of my scorecards not showing in the overview?
Why are some of my scorecards not showing in the overview?
By default, the dashboard only displays scorecards that have existing call data. This keeps the interface clean. If a scorecard has no logged calls against it, it will be hidden from the default view.
How do I add a new scorecard that doesn't have data yet?
How do I add a new scorecard that doesn't have data yet?
You can manually create a new scorecard view through the standard process. It will then appear in the Analytics overview with “0” data until calls are logged against it.
If I rename or reorder scorecards in one workspace, does it affect other workspaces?
If I rename or reorder scorecards in one workspace, does it affect other workspaces?
No. Customizations such as renaming and reordering are specific to each workspace. Changes made in one workspace do not impact any other workspace.